
Friday, December 7, 2012
Interning at the Charles Darwin Research Station
Thursday, December 6, 2012
Globalized Military Map
In Dr. Paul Kaldjians Independant Cartography Course I am set free with topics and abilities and created a new map along the military line that seems to be dominating my time lately. The map below is a map showing the known bases according to the Transnational Institute for Peace and Security. Coupled with a theory from David Vine the United States Military is seemingly consolidating it's infrastructure while adopting a "Lily-Pad" approach to bases. The map in full .pdf format can be downloaded here.


Wednesday, November 28, 2012
Geography of Wisconsin
Our Geography of Wisconsin class traveled on a field trip to the Door Peninsula of Wisconsin. After coming back from the Geo for Good workshop that Google hosted I used some of what I learned on the trip. Google's ODK Collect tool allows you to make your own blank field research forms. These forms are then attached to a web page that will collect the results. This is especially interesting because the ODK Collect tool was designed as an app that can be used on Android devices. While on the Wisconsin trip I made forms for the various sites we stopped at and then filled them out accordingly as we went. Collecting then exporting a .kml layer of the points you can then embed or convert the points to map in other software. I grouped together my trip project as a blog with the ODK points embedded in a Google gadget. The blog, the Google mapping tools, and a complete report on our trip can be viewed here "Geography of Wisconsin."
The ODK collect app can be used in a wide variety of applications. Designed to track elephant data in Africa anyone who is collecting data in the field should consider adapting a work flow to incorporate it's functionality.

The ODK collect app can be used in a wide variety of applications. Designed to track elephant data in Africa anyone who is collecting data in the field should consider adapting a work flow to incorporate it's functionality.

Thursday, November 15, 2012
Wisconsin Military Contracts

A Militarized Nation
Working in Paul Kaldjian's Independant Study that I am using as a base for advancing my cartography skills I started to dive into statistics put out by the United States Department of Defense. The map below illustrates a variety of stats including the workforce, facility size, and State GDP. The full .pdf can be found here.

*Text edits are still in the works

*Text edits are still in the works
Thursday, October 18, 2012
Outdoor Leadership
Through the University's Environmental Adventure Center I will be attending the Association of Outdoor Recreation and Education (AORE) national and professional development conference in November. To prepare for it I created this business card in Adobe Illustrator to help emphasize my outdoor skill set.

The following videos below are promotional clips put together using a Contour camera for my outdoor guiding position at UWEC's Environmental Adventure Center's (EAC).
Wednesday, October 3, 2012
Business Card
I put together this business card before going to the "Geo for Good" Workshop held by Google in Mountain View, California. The contour lines in the background are of West Glacier, Montana focusing on the Flathead river. This is also the river I commercially guided whitewater rafting trips on in the summer of 2011.


Wednesday, August 1, 2012
"Geo for Good" Workshop

"Geo for Good" is designed to introduce mapping professionals in the non-profit sector to a growing toolset offered by Google Outreach. Spatially representing data has empowering results when properly displayed to a large demographic. Currently being utilized in conservation efforts in Uganda and helping shed light on the genocide in Darfur Google's mapping tools are starting to show the power of geographic information systems.
For a couple weeks now, I have been involved in writing a draft proposal to Google on behalf of the CDF in order to identify the spatial needs and database requirements to upgrade our current system. The CDF wants to revitalize its information not just in a public serving platform but spatially enable it in order to visualize and reap the maximum benefits. I identified four major points that need to be addressed.
1. Database integration
2. Spatially enabling the data we already have
3. Auto-generated mapping solutions
4. Integrated Online Capacity
Combining the goals the CDF needs to focus on as well as Google's mapping resources is the first step in piecing together the complex solutions for many of the spatial needs of the CDF. Since I had a significant portion of this project already on my lap I pushed for the station to get two seats at the workshop in order to further utilize the collaboration of UWEC's Geography Department.
This morning I got news that I was able to attend the workshop with Daniel, the social sciences coordinator for the CDF. We'll be meeting up in Mountain View, California at the Google Headquarters on September 25th-29th. It's going to be a great opportunity to learn innovative mapping solutions to real world non-profit problems. At the same time it's a great way to stay in contact and collaboration with the CDF.
If all goes to plan I should be able to present the results as well as put together a mini-workshop for the Geography Department when I return.
Thursday, June 28, 2012
Update from the Station
I've made it down to the Charles Darwin Research Station and have become orientated to not only the lifestyle but to work as well.
Myself along with a co-worker from Spain are tasked with designing and creating a geodatabase that will allow data to be uploaded, manipulated, and served to the research community. The data we are working with ranges from vegetation zones to geological features and contains errors in everything from projections to accuracy. We first siphoned through this information and determined what could first be used, updated, or become labeled as junk.
Our workflow then shifted towards physically setting up a geodatabase that can be accessed on the server here. The resources available to a non-profit organization such as the CDRS are quite limited which puts a bind on what our capabilities are. However, this is also a great way to investigate and utilize freeware from the growing opensource GIS community.
We are currently still working on sewing together the nessesary parts to a whole but at the moment we have set up a database using postGIS on our server. This can then be accessed and added to by using a program called pgAdminIII. We are also currently trying to use the postGIS Raster extension to allow us to upload our raster information to the database as well. To manipulate our spatial information we are using another free software called QuantumGIS as well as wxGIScatalog to view/organize our spatially enabled information. We have overcame and continue to run into hiccups along the way in this process because our combined abilities don't reach as far into the programming world as we would like. Despite those hiccups we are building a new workflow and system for the CDRS and with new systems come minor bumps in the road.
On top of our major task, we are also a resource for many of the researchers that are employed here. I am fortunate enough to have been working with Henri Herrera an Entomologist here at the station. He is currently putting together his PhD on an invasive specie of large headed ants. I have been producing a series of maps for his paper. Although, compared to some of my past work may seem quite simple the processes behind them are definitly not. These maps were created using all free software including QuantumGIS, our postGIS database, Inkscape, as well as the catalog viewer wxGIScatalog. This work is leading to more maps that are going to be published in his papers towards the end of the year.


Friday, May 11, 2012
Onward to the Galapagos
Also on my Galapagos blog, this is a locator map along with a extruded digital elevation model to get a sense of place and topography around the Galapagos Islands. Originally a 11x17 the original file can be viewed HERE


Monday, April 30, 2012
The Middle East - How it Came Together
My Professor suggested that since my poster came together quite nicely that the judges at poster day might not assume that it was contructed from scratch. I put together a small 11x17 mini poster to attach to the side of my large Middle East map. Titled "The Cartography Behind the Map" this run through details the process of putting together a map of this caliber.

Thursday, April 26, 2012
Geography of the Middle East and North Africa

Final Advanced GIS Project
The wrap-up of Advanced GIs consists of making a poster. Instead of just making a poster we decided to get it done in time for Research Day. This is a gathering of all majors throughout the University to show off your research to others. Our poster/research consisted of trying to determine if the new social networking website Twitter could potentially predict elections. We chose the Ohio primaries and gathered tweets referring to the candidates names. The details and research can be viewed below. However the poster is quite large and be downloaded with detail on Media Fire.


Toolsets within advanced GIS Spring 2012
Advanced GIS is an awesome class that allows us to learn and implement a larger tool set within ArcGIS. We learn everything from network analysis, stream networking, interpolation (below), geo-coding, and many many more.
 Below is a lab that instead of making the required table in Microsoft word, I took a cartographic approach and made in Adobe Illustrator. Interpolation is the process of taking a few points and mathematically determining the space inbetween those points to create a surface similar to those you see everyday on something. There are many ways to calculate the surfaces between points which you can see above.

Monday, April 9, 2012
Environmental Adventure Center Spring Break Trip 2012
A step away from the GIS lab at UWEC I also work at the Environmental Adventure Center (EAC) on upper campus. March 2012 a geology colleague and myself planned, organized, and put into action a spring break trip to Moab, Utah. This was our second time taking a group of 9 students to Utah and had the chance to do a variety of activities. We visited Canyonlands National Park, Arches National Park, hiked, rafted a beautiful 15 mile section of the Colorado River, and mountain biked some of the best single track in the country. This was a great chance for me to test out my brand new ContourROAM HD point of view camera. The following is a quick edit of what our group got into while hanging out in Moab!
Wednesday, April 4, 2012
Spring 2011 Capstone
Spring 2011 I had taken Capstone (Geography 401) and chose to use the Mountain Pine Beetles damaging presence throughout the West. The Mountain Pine Beetle has been growing within mainstream media and directly affecting many industries in Western forests. Scientists are currently testing many different theories ranging from global climate change to diminishing bear habitat to CO2 carbon sinks. In my project for Capstone I chose to create a descriptive model based on many of the methods used in Bio-Geography in which we as a class created a descriptive model for boa constrictors in Cayos Cochinos, Honduras. The following is a result of my findings and with more time could be used to create a predictive model for Helena National Forest. Hosted on Media Fire a file sharing and backup website, it's a great way to insure your files are safe.
-A GIS Analysis of the Mountain Pine Beetle
-A GIS Analysis of the Mountain Pine Beetle
Friday, March 9, 2012
MENA project
Our second project in MENA class was to take our assigned country and define the SITE and SITUATION characteristics that the region was made up of. Although this project included a 4-6 page paper I decided to create visuals to the points I was trying to address.


Middle East and North Africa
Getting to more recent classes, this semester I am taking Middle East and North Africa (MENA) Geography. This is a super interesting class and the project our professor Paul Kaldjian has us doing allows for our creativity to soar. The first project we were to create our mental map of the MENA as well as a visually pleasing pie graph with examples. I decided to steer clear of Microsoft Excel and created my project with Adobe Illustrator.

Typography
Typography is the form of art by using words instead of standard shapes. Sparked by the interest of various typography maps online including the ones from Axis Maps I decided to create my own version for Eau Claire.


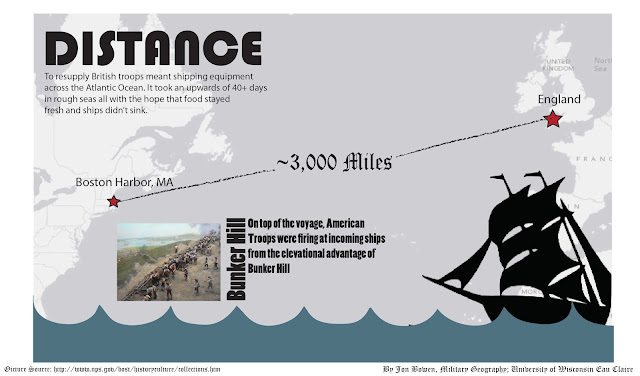
Military Geography
Our Military Geography class had a final project that consisted of identifying the evolution of first generational warfare. Although our group was misscommunitive the maps I produced were able to show how many different facets of war had evolved throughout the various battles that used first generational warfare.


Hawai'i Project
For Geography 368 last semester we all had a chance to use everything we've learned in both cultural and physical geography classes to grasp how special a place such as Hawai'i really is. The Big Island of Hawai'i was our focus and we covered everything from the highest peak to the beach. As a result of our trip we created a website. I was able to start taking my cartography skills to a graphic design direction. The following maps are a result of our class trip and our interpretation of the features we saw.


Subscribe to:
Posts (Atom)